Bubble trouble: Australia’s free market housing failure
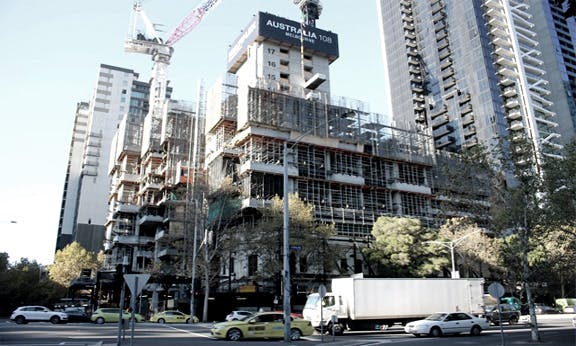
To understand the scale of the current property boom, consider that the number of fixed cranes atop dedicated residential projects in Sydney, Melbourne and Brisbane is greater than the combined total of New York, Boston, Washington (DC), Chicago, Toronto, Seattle, Portland, San Francisco, Los Angeles, Phoenix, Austin and Denver.
According to the Rider Levett Bucknall Crane Index, which gauges property markets worldwide, Sydney has 292 cranes – more than half the Australian total – building its residential skyline. Almost one-quarter of Australian cranes are working in the Victorian capital, but, unlike in Sydney, they are heavily concentrated in the rapidly saturating CBD market.
“Melbourne will soon have Australia’s tallest skyline, with more than 100 skyscrapers higher than 100 metres planned or already under construction”, Fairfax’s Aisha Dow wrote in February last year. “The rush of mostly residential towers is set to double the number of very tall buildings in the central city within just a few years.”
The speed of the urban transformation probably ranks third only to the heady days of the 1850s gold rush and the “marvellous Melbourne” extravagance of the 1870s and 1880s, when the city became one of the biggest in the Western world and a centre of finance. Both episodes ended in spectacular property price crashes. The situation today is a world apart, but not without a few similarities: rapid migration to a new cosmopolitan centre, a period of soaring incomes from mining booms and a dramatic expansion of credit all contributing to rampant land and financial speculation.
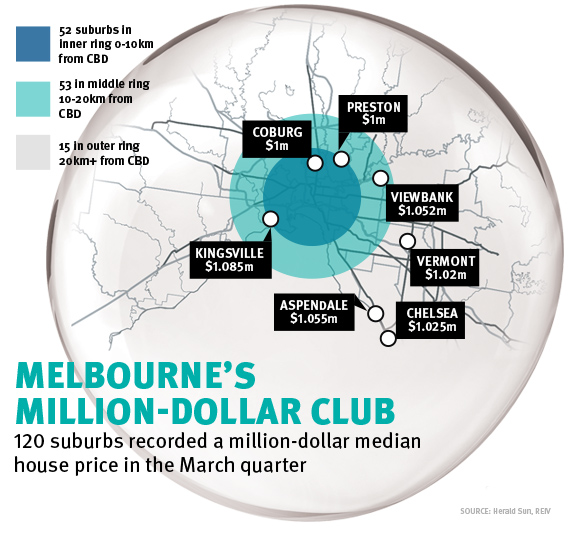
Over the last five years, the median house price in Sydney has increased by 82 percent and is now more than $1 million. In Melbourne, prices are up 36 percent – and 90 percent of suburbs within 10km of the CBD have a median price of $1 million or more. Elsewhere, the picture is more contradictory. But the two capitals are the most important areas, accounting for 43 percent of Australia’s GDP and two-thirds of GDP growth last year – a record that is underpinned by the surging construction and finance industries.
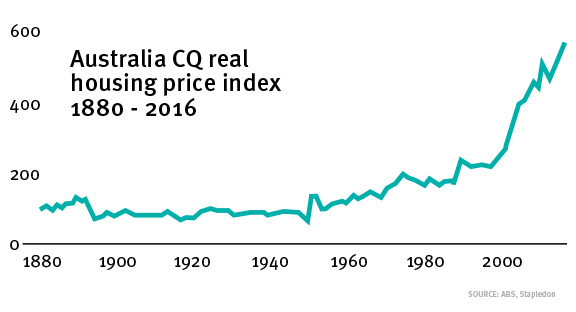
While the current situation is remarkable, there has also been a longer term trend for prices to rise. Since the late 1980s, lower interest rates and a series of tax concessions and policy changes resulted in land values growing well above the rate of inflation.
Market malfunction
From a social point of view, the property market is malfunctioning.
Sydney and Melbourne both rank in the top 10 most unaffordable cities in the world, according to the annual Demographia International Housing Affordability Survey. The home ownership rate among 25 to 34 year olds dropped from around 40 percent in 2002 to about 30 percent in 2014; among 35 to 44 year olds, it fell from 63 percent to 52 percent.
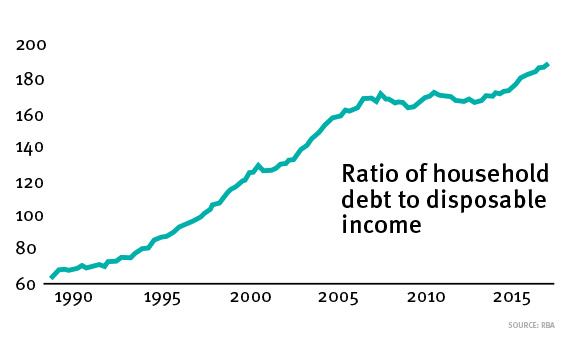
The country is in the grip of a debt crisis due to these rising prices. According to analysts at LF Economics, “Australia has the second-highest household debt to GDP ratio, the third-highest debt service ratio and various OECD reports show we have a household debt to income ratio that ranks Australia around fourth to seventh highest” in the world. From being less than 70 percent in the late 1980s, the ratio of household debt to disposable income has increased to almost 190 percent, driven primarily by rising property prices forcing purchasers to obtain larger mortgages.
There are contradictions in these figures. On one hand, the ability to access credit is often a signifier of a person’s privileged economic position, rather than some unavoidable peonage in the service of financial barons. For example, 70 percent of mortgage debt and 80 percent of investment property debt in Australia are held by the richest 40 percent of households, while the bottom 40 percent of households hold only 10 and 8 percent respectively. Two years ago, 40 percent of mortgage lending was to investors, rather than owner-occupiers. Today, after regulatory changes, investor loans account for 35 percent of mortgage lending. But in NSW, according to ANZ bank former chief economist Saul Eslake, only 5 percent of the market is first-home buyers, and investors make up 50 percent of Sydney purchases.
On the other hand, a significant proportion of the working class (often referred to as “middle Australia”, which we can loosely define as households with an income above the bottom 40 percent and below the top 20 percent) is highly indebted. Reserve Bank figures show that more than 40 percent of these households have a home mortgage and 10 percent hold an investment property mortgage. Digital Finance Analytics, a research and consultancy firm, notes the spread of financial stress:
“The highest risk of default resides in the [outer] suburbs, where a higher proportion of households are in severe stress [defined as those ‘who are behind with their repayments, are trying to sell, are trying to refinance, or who are being foreclosed’]. Households in inner regional Australia are next, followed by the inner suburbs, where again more households are in severe stress … [T]he highest count of defaults are likely among the suburban mainstream, then the disadvantaged fringe, followed by mature stable families and young growing families.”
And the sheer volume of debt (the value of total loans is now more than $1.5 trillion and is growing at more than twice the rate of inflation), combined with stagnating wages, has led to a peculiar “decoupling”. There used to be a pretty direct relationship between interest rates and mortgage stress – rates go up, stress goes up; rates go down, so too the stress. Since 2011, however, as interest rates have gone down, the proportion of households in mortgage stress has increased from 15 percent to around 22 percent. It would take only marginal rate increases to start pushing the default envelope, or sending substantial numbers of households into poverty.
Downturn?
The residential property boom’s effects have been more far reaching than those of the mining boom. The so-called economic multipliers of the construction of new dwellings and the renovation boom driven by the increased paper values of existing properties are significant – particularly in wholesale and retail trade. Just think of all the components and labour involved: carpets, paint, cladding, insulation, white goods, timber, concrete, furnishings and blinds, tiles, corrugated iron, heaters and airconditioners, garden plants and implements, lawn mowers, TVs etc.
The effect was particularly noticeable in the 21st century explosion and mass following of “home improvement” shows, sponsored of course by big retailers such as Bunnings: The Block, DIY Rescue, Backyard Blitz, Changing Rooms, Better Homes and Gardens, Location Location, Auction Squad, Hot Auctions, Grand Designs Australia, House Rules, Hot Property, Renovation Rescue, The Living Room and Reno Rumble.
There was no equivalent, There’s A Ferrous Metal Deposit Under My Front Porch, sponsored by Caterpillar. Nor could there have been: the mining investment boom was capital intensive, geographically remote and employed a tiny fraction of the labour force. By contrast, with real incomes rising, property values surging and income tax cuts being funded by revenues from the mining companies, millions of people could and did join the renovation game, often by refinancing their existing mortgages.
However, much of the property growth has characteristics of debt-driven speculation based on rising asset prices, far in advance of anything the minerals rush generated. Currently, interest-only loans make up nearly 40 percent of all lending by the big four banks. With debt servicing costs lower than the capital gains of the assets, more money floods into the market, further inflating prices and the amount of debt required to “buy in”. But the exuberance can continue only as long as the asset prices continue to appreciate, because there are further purchasers prepared to buy into the market. If and when their numbers fall, the virtuous circle can become vicious as assets are sold off when debts are called in.
Exactly how this ends is unclear: What would be the result of a substantial and sustained drop? The IMF in 2015 estimated that a 10 percent fall in house prices would reduce household wealth by 30 percent. How would that interact with the current flat wages growth, increasing income tax burden and a slowing economy? What’s the household debt ceiling? And what happens to consumer demand even if all things remain somewhat the same, given the rising levels of mortgage stress? Results of other property crashes are not encouraging: look at what happened over the last decade in the US, Britain, Ireland and Spain, for example.
Recent figures suggest that the market is cooling, with house price declines in Melbourne and Sydney. But there have been temporary falls like this in recent years, only for the growth to surge ahead again under the influence of hot money and “animal spirits”.
Unit prices, however, are certain to fall as the massive construction boom floods the market over the next year. At the end of 2016 there were 218,000 dwellings, the vast majority apartments, under construction. And already, there have been double-digit declines over the last 12 months in the Melbourne suburbs of Carlton, Essendon, Caulfield, Cremorne, Kew, South Melbourne and Ascot Vale. It’s the same in a number of Brisbane areas: West End, Wooloowin, Fortitude Valley, Kelvin Grove and others. We’ll have to wait to see what Sydney brings.
The other factor in the equation is the dependence of state governments on property taxes to fund infrastructure spending, social services and public sector wages. In New South Wales, stamp duties and land taxes are the second and third largest government revenue sources. Forty-five percent of the Victorian government’s tax revenues are sourced from them. Budget forecasts show that these state governments are banking on the boom continuing for several years to fund existing spending commitments. If Treasury assumptions don’t hold, there will be a huge hit to state coffers before even considering any of the effects of a property-induced economic downturn.
A right, not a commodity
Australia has always had a high dependence on private (market) provision of housing. That goes back to colonial-era attempts to domesticate ex-convicts and create a layer of peasant farmers, through small-plot land grants. The attempt to build some sort of “ownership society” ramped up post-federation and particularly after the Second World War under Liberal prime minister Robert Menzies. In his view, property ownership would give people “a stake in the country” and promote self-reliance “by self-sacrifice, by frugality and saving”. “The home is the foundation of sanity and sobriety”, he said in the famous “forgotten people” speech; “it is the indispensable condition of continuity; its health determines the health of society as a whole”.
Under Menzies, around 30 percent of all Commonwealth funds were set aside to promote owner-occupation of housing. Between 1945 and 1960 about 900,000 new dwellings were completed. Public housing was also sold to tenants at this time: between 1956 and 1963, the NSW Housing Commission sold 80 percent of all houses that it constructed. Australia built the highest home ownership rate in the world – growing from just over 50 percent of households in 1947 to 70 percent 14 years later.
This was a logical endeavour for a government in a capitalist society, and mirrored broader property relations while attempting to conceal the fact that a house provided no real stake in a system that centralised the ownership of society’s productive assets – agricultural land, mines, factories and office buildings etc. – in the hands of a minority, thereby denying the working majority any control over or ownership of the production of social goods.
So, in reality, a “stake in the country” was and remains a myth obscuring the fact that a basic human right – shelter – was made a commodity in the first place. Not only did that mean that whole sections of the population were without housing security. Not only did it mean that the majority became indebted for decades and, through interest payments to secure a modest home, underpinned bank profits. Over time, due to deliberate government policies, housing has become an investor paradise, allowing a small group to become tremendously wealthy at the expense of denying millions of people access to the very stake they were encouraged to desire.
The speculation has become so widespread, the exuberance so wild, that it now threatens a downturn that could rip the heart out of the broader economy. That might ruin a bunch of high end investors who have made a killing over the last decades. But the real devastation would be felt, as usual, among the ranks of the working class, who, in the worst case scenario, stand to lose, not just “assets”, but homes and livelihoods.
The answer to this gambling with our lives is not more schemes that pump billions of dollars into the private market to hold up demand – first-home buyer grants, tax incentives, cuts to stamp duty, release of cheap land for developers and so on. The government already provides $12 billion per year of indirect private housing subsidies (double the amount spent on social housing), which only help to further inflate prices. The National Centre for Social and Economic Modelling estimates that $7.7 billion in revenue is lost every year to negative gearing and the capital gains tax discount, which allow investors to write off investment property losses and reduce the tax they pay on investment property price rises. Overwhelmingly, these tax incentives benefit the wealthy.
These billions of dollars should, at a minimum, be captured and ploughed into public housing to guarantee every person not just a house, but a home for life – and the security that comes with it. Moreover, housing (along with health, education, water and utilities among other things) should be secured as a right, rather than a commodity accessible only to those with the funds to buy it.